AirBnB Listing Analysis
Analysis of Airbnb listings in Paris to determine the impact of recent regulations
Objectives
- Explore and profile the data to correct any quality issues.
- Prepare and reformat the data for visualization.
- Visualize the data and identify key insights and recommendations.
import pandas as pd
import seaborn as sns
import geopandas as gpd
import matplotlib.pyplot as plt
listings = pd.read_csv("Listings.csv", encoding="ISO-8859-1", low_memory=False ) #The encoding used (ISO-8859-1) allows the file to be read without errors.
Data Overview
The dataset contains 33 columns with mixed data types. As noted earlier, hostsince represents a date but is currently stored as an object, so it will be converted to datetime.
Profile & QA the data
listings.head()
listing_id name host_id \
0 281420 Beautiful Flat in le Village Montmartre, Paris 1466919
1 3705183 39 mò Paris (Sacre CÃ
âur) 10328771
2 4082273 Lovely apartment with Terrace, 60m2 19252768
3 4797344 Cosy studio (close to Eiffel tower) 10668311
4 4823489 Close to Eiffel Tower - Beautiful flat : 2 rooms 24837558
host_since host_location host_response_time \
0 2011-12-03 Paris, Ile-de-France, France NaN
1 2013-11-29 Paris, Ile-de-France, France NaN
2 2014-07-31 Paris, Ile-de-France, France NaN
3 2013-12-17 Paris, Ile-de-France, France NaN
4 2014-12-14 Paris, Ile-de-France, France NaN
host_response_rate host_acceptance_rate host_is_superhost \
0 NaN NaN f
1 NaN NaN f
2 NaN NaN f
3 NaN NaN f
4 NaN NaN f
host_total_listings_count ... minimum_nights maximum_nights \
0 1.0 ... 2 1125
1 1.0 ... 2 1125
2 1.0 ... 2 1125
3 1.0 ... 2 1125
4 1.0 ... 2 1125
review_scores_rating review_scores_accuracy review_scores_cleanliness \
0 100.0 10.0 10.0
1 100.0 10.0 10.0
2 100.0 10.0 10.0
3 100.0 10.0 10.0
4 100.0 10.0 10.0
review_scores_checkin review_scores_communication review_scores_location \
0 10.0 10.0 10.0
1 10.0 10.0 10.0
2 10.0 10.0 10.0
3 10.0 10.0 10.0
4 10.0 10.0 10.0
review_scores_value instant_bookable
0 10.0 f
1 10.0 f
2 10.0 f
3 10.0 f
4 10.0 f
[5 rows x 33 columns]
We can see the columns we have and its datatypes, in this case previusly we saw
The dataset contains 33 columns with mixed data types. As noted earlier, host_since represents a date but is currently stored as an object, so it will be converted to datetime
listings.info()
<class 'pandas.core.frame.DataFrame'>
RangeIndex: 279712 entries, 0 to 279711
Data columns (total 33 columns):
 #   Column                       Non-Null Count   Dtype
---  ------                       --------------   -----
 0   listing_id                   279712 non-null  int64
 1   name                         279537 non-null  object
 2   host_id                      279712 non-null  int64
 3   host_since                   279547 non-null  object
 4   host_location                278872 non-null  object
 5   host_response_time           150930 non-null  object
 6   host_response_rate           150930 non-null  float64
 7   host_acceptance_rate         166625 non-null  float64
 8   host_is_superhost            279547 non-null  object
 9   host_total_listings_count    279547 non-null  float64
 10  host_has_profile_pic         279547 non-null  object
 11  host_identity_verified       279547 non-null  object
 12  neighbourhood                279712 non-null  object
 13  district                     37012 non-null   object
 14  city                         279712 non-null  object
 15  latitude                     279712 non-null  float64
 16  longitude                    279712 non-null  float64
 17  property_type                279712 non-null  object
 18  room_type                    279712 non-null  object
 19  accommodates                 279712 non-null  int64
 20  bedrooms                     250277 non-null  float64
 21  amenities                    279712 non-null  object
 22  price                        279712 non-null  int64
 23  minimum_nights               279712 non-null  int64
 24  maximum_nights               279712 non-null  int64
 25  review_scores_rating         188307 non-null  float64
 26  review_scores_accuracy       187999 non-null  float64
 27  review_scores_cleanliness    188047 non-null  float64
 28  review_scores_checkin        187941 non-null  float64
 29  review_scores_communication  188025 non-null  float64
 30  review_scores_location       187937 non-null  float64
 31  review_scores_value          187927 non-null  float64
 32  instant_bookable             279712 non-null  object
dtypes: float64(13), int64(6), object(14)
memory usage: 70.4+ MB
listings["host_since"] = pd.to_datetime(listings["host_since"])
listings.info()
<class 'pandas.core.frame.DataFrame'>
RangeIndex: 279712 entries, 0 to 279711
Data columns (total 33 columns):
 #   Column                       Non-Null Count   Dtype
---  ------                       --------------   -----
 0   listing_id                   279712 non-null  int64
 1   name                         279537 non-null  object
 2   host_id                      279712 non-null  int64
 3   host_since                   279547 non-null  datetime64[ns]
 4   host_location                278872 non-null  object
 5   host_response_time           150930 non-null  object
 6   host_response_rate           150930 non-null  float64
 7   host_acceptance_rate         166625 non-null  float64
 8   host_is_superhost            279547 non-null  object
 9   host_total_listings_count    279547 non-null  float64
 10  host_has_profile_pic         279547 non-null  object
 11  host_identity_verified       279547 non-null  object
 12  neighbourhood                279712 non-null  object
 13  district                     37012 non-null   object
 14  city                         279712 non-null  object
 15  latitude                     279712 non-null  float64
 16  longitude                    279712 non-null  float64
 17  property_type                279712 non-null  object
 18  room_type                    279712 non-null  object
 19  accommodates                 279712 non-null  int64
 20  bedrooms                     250277 non-null  float64
 21  amenities                    279712 non-null  object
 22  price                        279712 non-null  int64
 23  minimum_nights               279712 non-null  int64
 24  maximum_nights               279712 non-null  int64
 25  review_scores_rating         188307 non-null  float64
 26  review_scores_accuracy       187999 non-null  float64
 27  review_scores_cleanliness    188047 non-null  float64
 28  review_scores_checkin        187941 non-null  float64
 29  review_scores_communication  188025 non-null  float64
 30  review_scores_location       187937 non-null  float64
 31  review_scores_value          187927 non-null  float64
 32  instant_bookable             279712 non-null  object
dtypes: datetime64[ns](1), float64(13), int64(6), object(13)
memory usage: 70.4+ MB
""""listings = pd.read_csv("Listings.csv", encoding="ISO-8859-1", low_memory=False )""""
Next, a subset is created containing only the columns required for this analysis.
paris_listings = (
    listings
    .query("city == 'Paris'")
    .loc[:,["host_since", "neighbourhood", "city", "accommodates", "price"]])
paris_listings.info()
<class 'pandas.core.frame.DataFrame'>
Index: 64690 entries, 0 to 279711
Data columns (total 5 columns):
 #   Column         Non-Null Count  Dtype
---  ------         --------------  -----
 0   host_since     64657 non-null  datetime64[ns]
 1   neighbourhood  64690 non-null  object
 2   city           64690 non-null  object
 3   accommodates   64690 non-null  int64
 4   price          64690 non-null  int64
dtypes: datetime64[ns](1), int64(2), object(2)
memory usage: 3.0+ MB
Data Cleaning
The non-null count for hostsince does not match the total number of rows, so the next step is to check for missing values and quantify them.
paris_listings.isna().sum()
host_since       33
neighbourhood     0
city              0
accommodates      0
price             0
dtype: int64
host_since_nulls = paris_listings[paris_listings["host_since"].isna()]
host_since_nulls
       host_since        neighbourhood   city  accommodates  price
52879         NaT    Enclos-St-Laurent  Paris             2     57
52880         NaT    Enclos-St-Laurent  Paris             2     58
52881         NaT  Batignolles-Monceau  Paris             4     90
52882         NaT    Buttes-Montmartre  Paris             5     89
52883         NaT       Hotel-de-Ville  Paris             2    119
52884         NaT    Buttes-Montmartre  Paris             4     50
52885         NaT    Enclos-St-Laurent  Paris             6    220
52886         NaT           Popincourt  Paris             2     45
52887         NaT           Popincourt  Paris             4    100
52888         NaT         Menilmontant  Paris             2     50
52889         NaT    Enclos-St-Laurent  Paris             2     45
52890         NaT           Popincourt  Paris             2     85
52891         NaT    Buttes-Montmartre  Paris             2     70
52892         NaT         Observatoire  Paris             2     85
83070         NaT           Popincourt  Paris            12    510
83071         NaT           Popincourt  Paris             2     50
97760         NaT         Menilmontant  Paris             8    145
207306        NaT    Buttes-Montmartre  Paris             2     52
207316        NaT            Vaugirard  Paris             2     55
229854        NaT    Buttes-Montmartre  Paris             4     84
229855        NaT           Popincourt  Paris             2     55
229856        NaT       Hotel-de-Ville  Paris             2     85
229857        NaT         Menilmontant  Paris             2    100
229858        NaT         Menilmontant  Paris             6    120
229859        NaT             Pantheon  Paris             2     50
229860        NaT                Passy  Paris             3     95
229861        NaT                Opera  Paris             2     50
229862        NaT           Popincourt  Paris             2     40
229863        NaT    Enclos-St-Laurent  Paris             2     35
229864        NaT               Temple  Paris             4    190
229865        NaT                Opera  Paris             6    150
229866        NaT                Passy  Paris             2     80
229867        NaT       Palais-Bourbon  Paris             2     95
The 33 records with missing host_since values were removed after reviewing their distribution across neighbourhoods, accommodation capacity, and price. They represented approximately 0.05% of the dataset and did not form an analytically distinct group. Since host_since is required to compute host tenure, retaining missing dates would prevent consistent feature engineering. Removing these records preserves data consistency with negligible impact on sample size
paris_listings_clean = paris_listings.dropna(subset=["host_since"]).copy()
paris_listings_clean.isna().sum()
host_since       0
neighbourhood    0
city             0
accommodates     0
price            0
dtype: int64
Summary statistics can be reviewed using the following method.
paris_listings_clean.describe()
                          host_since  accommodates         price
count                          64657  64657.000000  64657.000000
mean   2015-11-01 11:06:05.528867328      3.037877    113.104614
min              2008-08-30 00:00:00      0.000000      0.000000
25%              2014-03-09 00:00:00      2.000000     59.000000
50%              2015-07-07 00:00:00      2.000000     80.000000
75%              2017-05-29 00:00:00      4.000000    120.000000
max              2021-02-07 00:00:00     16.000000  12000.000000
std                              NaN      1.588382    214.479626
This summary reveals a data quality issue: both accommodates and price contain zero values, which are implausible and likely indicate data-entry errors. The next step verifies how many rows are affected.
Rows with zero values in accommodates and price were removed during data cleaning. Although they represent a very small fraction of the dataset and would not materially change the results, removing them ensures all observations are valid and consistent for downstream analysis.
paris_listings_clean.query("accommodates == 0" ).count()
host_since       54
neighbourhood    54
city             54
accommodates     54
price            54
dtype: int64
paris_listings_clean.query("price== 0" ).count()
host_since       62
neighbourhood    62
city             62
accommodates     62
price            62
dtype: int64
paris_listings_clean = paris_listings_clean[
    (paris_listings_clean["accommodates"] != 0) &
    (paris_listings_clean["price"] != 0)
]
paris_listings_clean.query("accommodates == 0").count()
host_since       0
neighbourhood    0
city             0
accommodates     0
price            0
dtype: int64
paris_listings_clean.query("price == 0").count()
host_since       0
neighbourhood    0
city             0
accommodates     0
price            0
dtype: int64
Data Preparation for Visualization
This table groups Paris listings by neighbourhood and calculates the average price, sorted in ascending order.
paris_listings_clean_nb = (
    paris_listings
    .groupby("neighbourhood")
    .agg({"price": "mean"})
    .sort_values("price")
)
paris_listings_clean_nb
                          price
neighbourhood
Menilmontant          74.942257
Buttes-Chaumont       82.690182
Buttes-Montmartre     87.209479
Reuilly               89.058402
Popincourt            90.559459
Gobelins              98.110184
Observatoire         101.866801
Batignolles-Monceau  102.612702
Enclos-St-Laurent    102.967156
Vaugirard            106.831330
Opera                119.038644
Pantheon             122.662150
Temple               138.446823
Hotel-de-Ville       144.472110
Bourse               149.496801
Luxembourg           155.638639
Palais-Bourbon       156.856578
Passy                161.144635
Louvre               175.379972
Elysee               210.536765
This table filters listings to the most expensive neighbourhood, groups them by accommodates, and calculates the average price for each group in ascending order.
paris_listings_clean_acc = (
    paris_listings_clean
    .query("neighbourhood == 'Elysee'")
    .groupby("accommodates")
    .agg({"price": "mean"})
    .sort_values("price")
)
paris_listings_clean_acc.describe()
            price
count   15.000000
mean   466.082793
std    277.068449
min     79.522222
25%    270.456572
50%    411.538462
75%    664.812500
max    971.000000
This table groups listings by the year hosts joined (hostsince) and calculates the average price and number of new hosts per year.
paris_listingsis_ot = (
    paris_listings_clean
    .set_index("host_since")
    .resample("YE")
    .agg({
        "neighbourhood": "count",
        "price": "mean"
    })
)
paris_listingsis_ot
            neighbourhood       price
host_since
2008-12-31              4   77.750000
2009-12-31            106  159.641509
2010-12-31            416  125.031250
2011-12-31           1339  124.828230
2012-12-31           4592  111.578615
2013-12-31           8142  107.096414
2014-12-31          10922  100.253800
2015-12-31          12147  103.646250
2016-12-31           8867  114.211345
2017-12-31           4585  108.658888
2018-12-31           4294  138.209362
2019-12-31           5685  129.962533
2020-12-31           3363  143.517098
2021-12-31            133   93.488722
The .agg() method is required because .resample('YE') only groups listings by year; it does not define how the records within each year should be summarized. Aggregation converts individual listing records into meaningful yearly metrics — counting non-null neighbourhood values to estimate new listings and averaging price to obtain the yearly mean.
Data Visualization
The following horizontal bar chart shows the average price by neighbourhood in Paris.
(paris_listings_clean_nb
 .plot
 .barh(
     title = "Average listing price by Paris Neighbourhood",
     xlabel = "Price Per Night (Euros)",
     ylabel = "Neighbourhood",
     legend = None
 )
)
sns.despine() #to remove the top and righ border
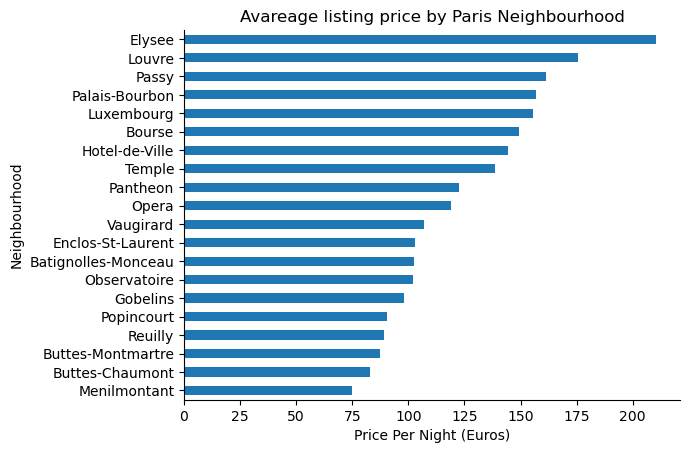 Chart 1
Creation of a map chart of the average price by neighborhood in Paris
paris_map = gpd.read_file("paris_nbs.geojson")
paris_map = paris_map.merge(
    paris_listings_clean_nb,
    left_on="name",
    right_on="neighbourhood",
    how="left"
)
fig, ax = plt.subplots(1, 1, figsize=(12, 12))
paris_map.plot(
    column="price",
    cmap="Reds",
    legend=True,
    edgecolor="black",
    linewidth=0.3,
    ax=ax
)

# Cambia "neighbourhood" por el nombre real de tu columna si es distinto
for idx, row in paris_map.iterrows():
    x, y = row.geometry.representative_point().coords[0]
    ax.annotate(
        text=row["neighbourhood"],
        xy=(x, y),
        ha="center",
        fontsize=6,
        color="black"
    )


ax.set_title("Average listing price by Paris Neighbourhood")
ax.axis("off")
plt.show()
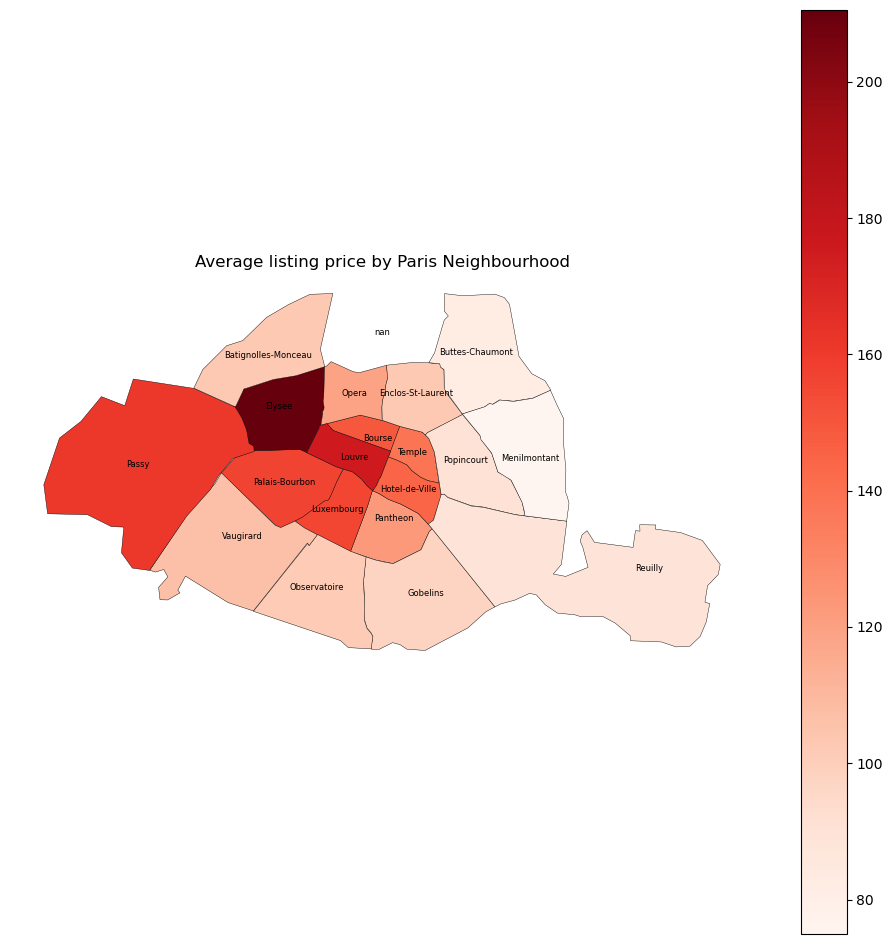 Chart 2
Creation of a horizontal bar chart of the average price by ‘accommodates’ in Paris’ most expensive neighborhood
(paris_listings_clean_acc
 .plot
 .barh(
     title = "Avareage listing price by Accommodation Number",
     xlabel = "Price Per Night (Euros)",
     ylabel = "Accommodation Capacity",
     legend = None
 )
)
sns.despine()
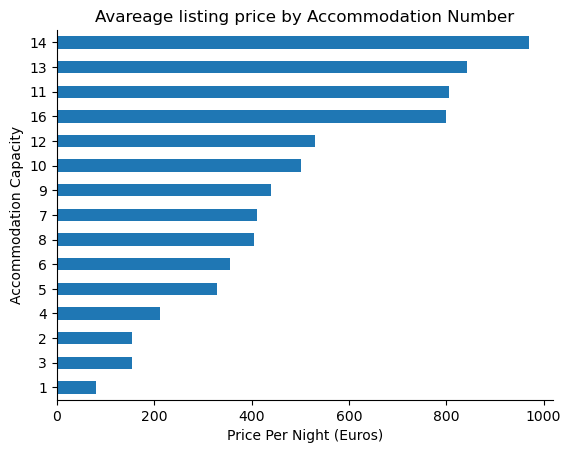 Chart 3
Creation of two line charts: one showing the count of new hosts over time, and one showing average price
paris_listingsis_ot["neighbourhood"].plot(
    ylabel = "New Hosts",
    title = "New AirBnB Host in Paris Over Time"
)
sns.despine()
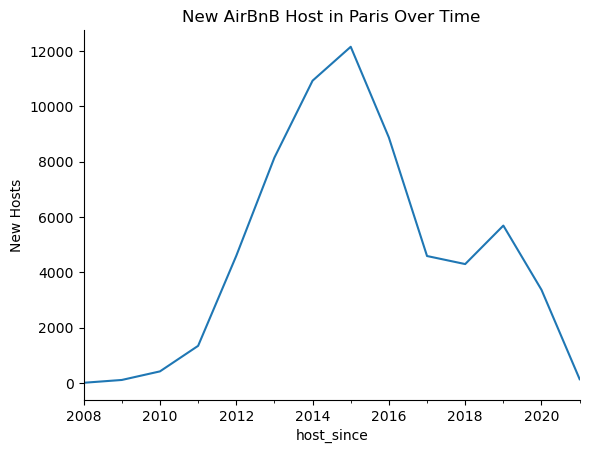 Chart 4
paris_listingsis_ot["price"].plot(
    ylabel = "Average Price (Euros)",
    title = "Average AirBnB Price Over Time"
)
sns.despine()
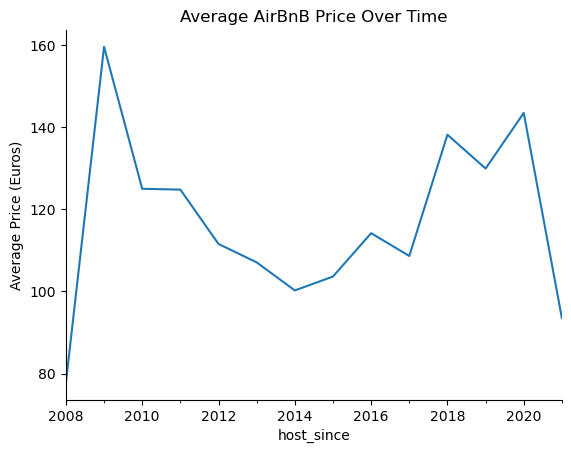 Chart 5
fig, ax = plt.subplots()

ax.plot(
    paris_listingsis_ot.index,
    paris_listingsis_ot["neighbourhood"],
    label = "New Hosts",
    c = "pink"
)
ax.set_ylabel("New Hosts")

ax2 = ax.twinx()
ax2.plot(
    paris_listingsis_ot.index,
    paris_listingsis_ot["price"],
    label = "Average Price",
    c = "blue"
)

ax2.set_ylabel("Average Price")
ax2.set_ylim(0)

ax.set_title("2015 Regulations Lead to Fewer New Host, Higher Prices")
lines1, labels1 = ax.get_legend_handles_labels()
lines2, labels2 = ax2.get_legend_handles_labels()
ax.legend(lines1 + lines2, labels1 + labels2, loc="lower center")
<matplotlib.legend.Legend at 0x1d207ac3520>
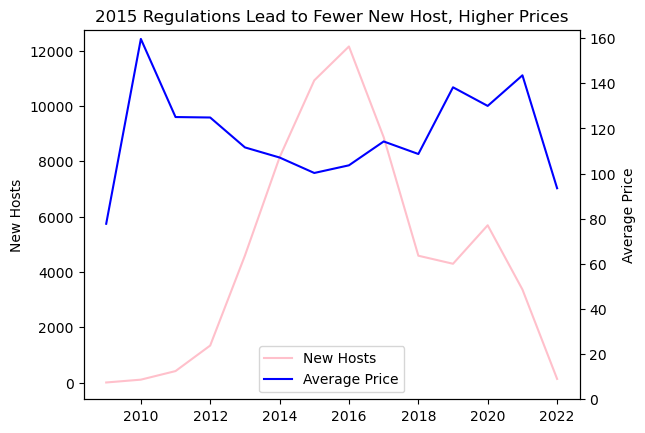 Chart 6